Product Tour
See What PalletVision Looks Like From the Inside
Real screenshots from production deployments. This is what your team sees when PalletVision is running on your floor.
Know Exactly How Long Every Pallet Takes to Build
For the first time, get exact build times for every pallet that moves through your line — without clipboards or manual tracking. See which sizes take longer, compare build processes across stations, and find the bottlenecks you could never measure before.
Build Time by Pallet Size
See how long each size takes to build so you can quote and plan more accurately
Compare Stations & Crews
Find which stations or shifts build faster and understand what they do differently
Spot Idle Time & Delays
Know when a station is sitting empty so you can keep pallets moving through the line
Real-Time Production Dashboard
See what every line is producing right now. Daily counts, hourly breakdowns, and shift comparisons — all in one view. Filter by date range, camera, zone, or shift. Export flat files for your records or ERP reconciliation.
- See what every line is producing right now
- Daily counts, hourly breakdowns, and shift comparisons — all in one view
- Filter by date range, camera, zone, or shift

Hourly Production Breakdown
Stacked bar charts show production by hour across the day. Spot peak hours, shift transitions, and bottlenecks at a glance. Compare operation types side by side to understand how your floor moves.
- Stacked bar charts show production by hour across the day
- Spot peak hours, shift transitions, and bottlenecks at a glance
- Compare operation types side by side to understand how your floor moves

Month-at-a-Glance Performance
Color-coded days show whether targets were met, exceeded, or missed. Paired with a daily efficiency gauge so you can see trends at a glance without pulling reports.
- Color-coded days show whether targets were met, exceeded, or missed
- Paired with a daily efficiency gauge so you can see trends at a glance without pulling reports

Per-Camera Production Counts
Drill into individual camera and station performance. See hourly output for each camera to pinpoint which stations are outperforming or falling behind.
- Drill into individual camera and station performance
- See hourly output for each camera to pinpoint which stations are outperforming or falling behind

Production Leaderboard
Track progress toward daily targets for every station. Actual vs. target counts, percentage achieved, and units remaining — so you know which lines need attention before the shift ends.
- Track progress toward daily targets for every station
- target counts, percentage achieved, and units remaining — so you know which lines need attention before the shift ends

Zone-Level Performance
Monitor production zones with efficiency gauges, target comparisons, and trend indicators. See at a glance whether each zone is improving or declining compared to the previous period.
- Monitor production zones with efficiency gauges, target comparisons, and trend indicators
- See at a glance whether each zone is improving or declining compared to the previous period

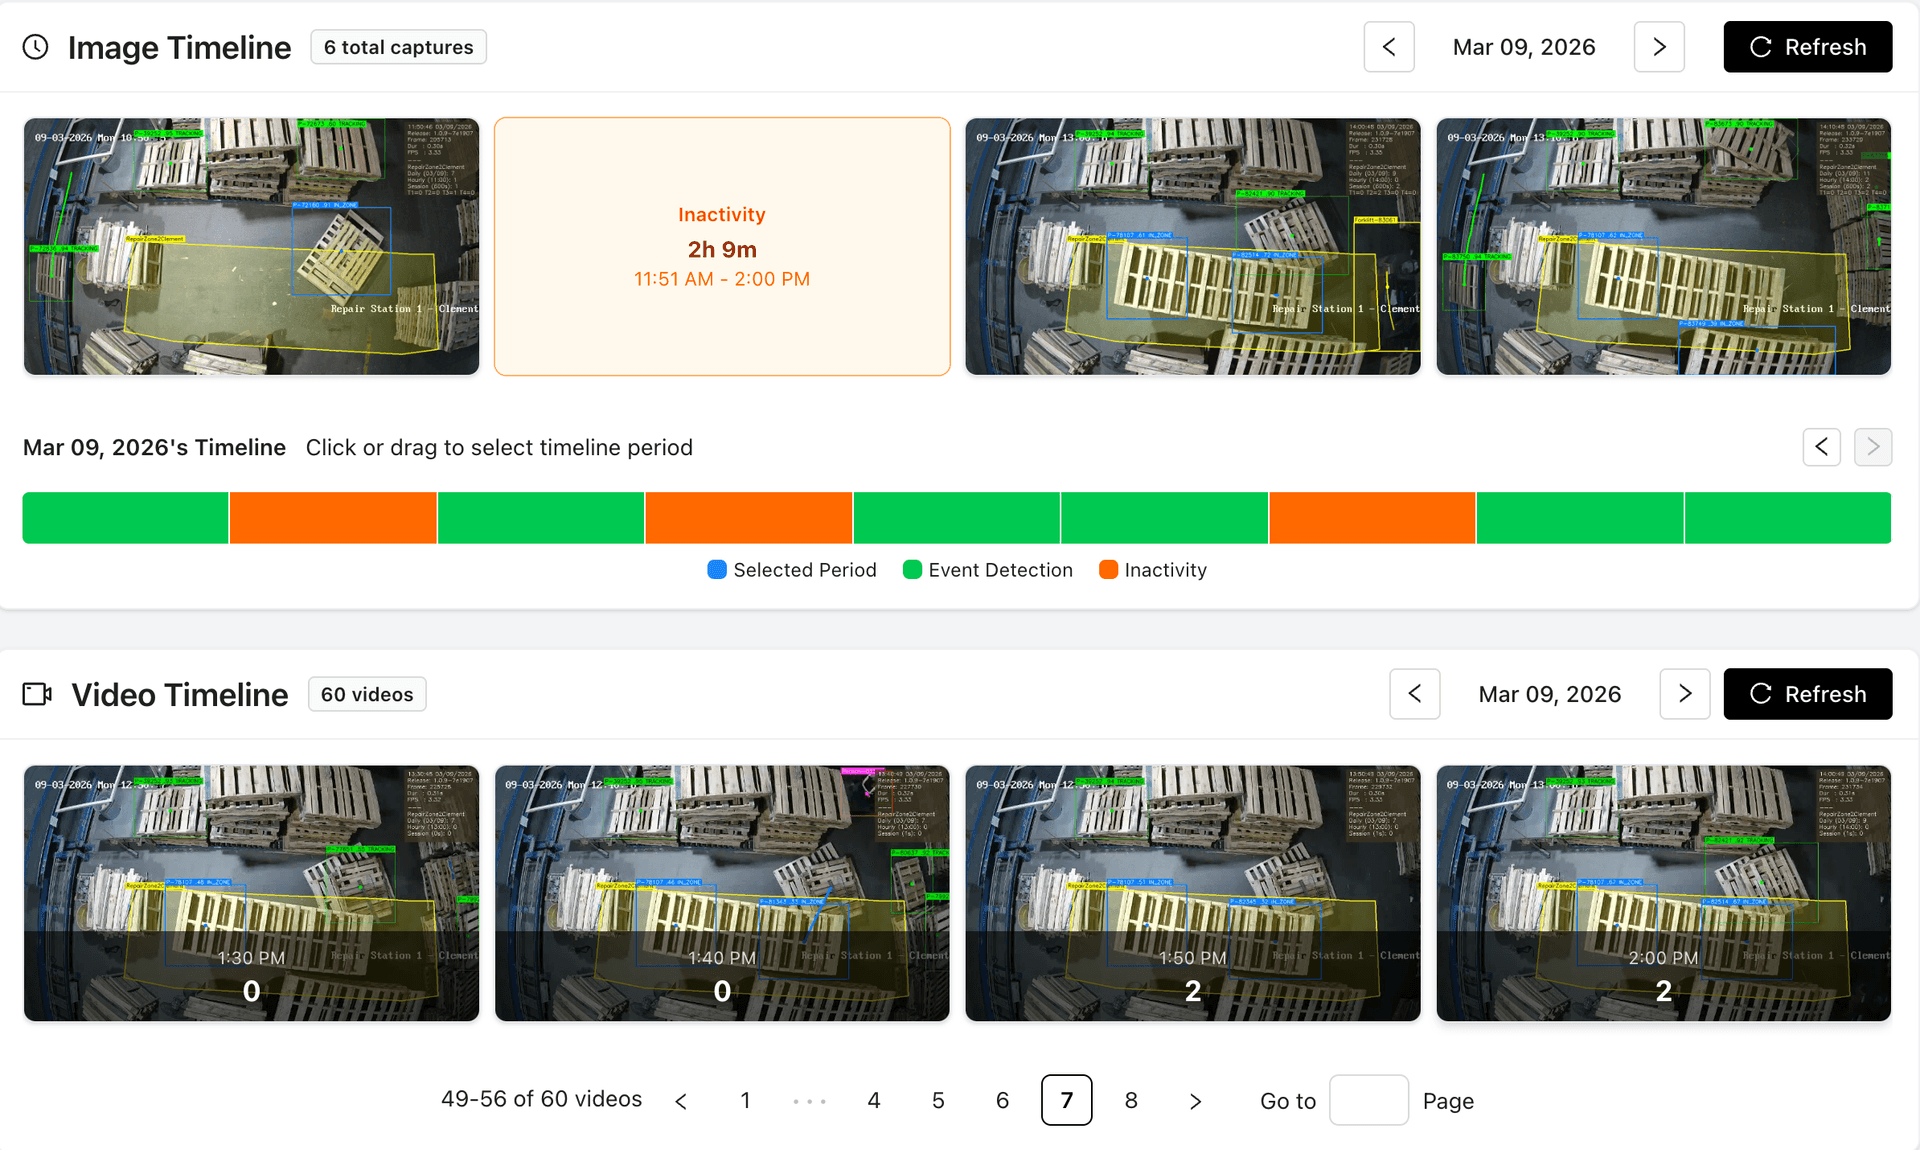
Video Event Timeline
Every pallet detected is logged on a timeline synced to camera footage. Supervisors can review specific events, verify counts, and investigate anomalies with video context — no need to scrub through hours of footage.
- Every pallet detected is logged on a timeline synced to camera footage
- Supervisors can review specific events, verify counts, and investigate anomalies with video context — no need to scrub through hours of footage
AI Accuracy & Review Tools
Monitor detection accuracy per camera with built-in review tools. See camera-wise accuracy scores and review flagged events to ensure your counts stay reliable over time.
- Monitor detection accuracy per camera with built-in review tools
- See camera-wise accuracy scores and review flagged events to ensure your counts stay reliable over time

See It Running Live
Watch PalletVision detect and count pallets in real production environments. These are actual camera feeds from deployed systems.
Pallet Build Counting
Repair Line Tracking
Dismantling Detection
From Our Customers
What Teams See After Deploying
“We used to rely on clipboards and end-of-shift tallies. PalletVision gave us live numbers on every line — our supervisors finally know what is happening without walking the floor.”
Alex Alfonso
Plant Head, Amigo Pallets
“We repurposed our existing surveillance cameras into a fully functional AI-driven productivity system. For the first time, we had accurate visibility into daily dismantling output — and once we saw those results, we expanded to trim saws, repair stations, and custom build areas. It has meaningfully upgraded our operations.”
Nik Bojovic
General Manager, City Pallets
Ready to See This on Your Floor?
Schedule a personalized demo and we’ll show you PalletVision configured for your line layout and camera setup.